
Explore key volatility indicators and discover how to utilize them to enhance your trading strategies
Market volatility plays a crucial role in trading decisions, as it affects the profitability and risk associated with different financial instruments. Understanding and effectively utilizing volatility indicators can provide valuable insights into market conditions and help traders make informed trading decisions. In this article, we will explore some essential volatility indicators and demonstrate their applications in trading strategies using Python.
Importing the Required Modules
To begin, let’s import the necessary modules and libraries in Python that will be used in our analysis and implementation:
import numpy as np
import pandas as pd
import matplotlib.pyplot as plt
import seaborn as sns
from datetime import datetime
import yfinance as yf
Gathering Historical Price Data
Next, we need to gather historical price data for the financial instrument we want to analyze. We will use the Yahoo Finance library (yfinance) to fetch the data. In this example, let’s consider the stock symbol “AAPL” (Apple Inc.):
# Define the symbol and time period
symbol = "AAPL"
start_date = datetime(2022, 1, 1)
end_date = datetime(2022, 12, 31)# Fetch the historical price data
data = yf.download(symbol, start=start_date, end=end_date)
# Print the first few rows of the data
print(data.head())
Now that we have our price data, let’s explore some popular volatility indicators and their applications:
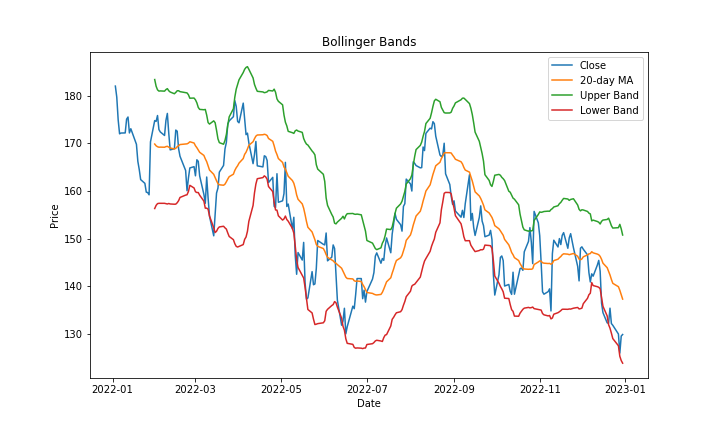
Bollinger Bands
Bollinger Bands consist of a middle band (usually a moving average) and upper and lower bands that represent the standard deviations of the price. They provide insights into the volatility and potential reversal points in the market. Here’s how to calculate and plot Bollinger Bands:
# Calculate the Bollinger Bands
data["20-day MA"] = data["Close"].rolling(window=20).mean()
data["Upper Band"] = data["20-day MA"] + 2 * data["Close"].rolling(window=20).std()
data["Lower Band"] = data["20-day MA"] - 2 * data["Close"].rolling(window=20).std()# Plot the Bollinger Bands
plt.figure(figsize=(10, 6))
plt.plot(data.index, data["Close"], label="Close")
plt.plot(data.index, data["20-day MA"], label="20-day MA")
plt.plot(data.index, data["Upper Band"], label="Upper Band")
plt.plot(data.index, data["Lower Band"], label="Lower Band")
plt.title("Bollinger Bands")
plt.xlabel("Date")
plt.ylabel("Price")
plt.legend()
plt.show()

Average True Range (ATR)
ATR measures the average range between the high and low prices over a specified period. It helps traders gauge the volatility and potential stop-loss levels for their trades. Here’s how to calculate and plot ATR:
# Calculate the Average True Range
data["High-Low"] = data["High"] - data["Low"]
data["High-PrevClose"] = abs(data["High"] - data["Close"].shift(1))
data["Low-PrevClose"] = abs(data["Low"] - data["Close"].shift(1))
data["TR"] = data[["High-Low", "High-PrevClose", "Low-PrevClose"]].max(axis=1)
data["ATR"] = data["TR"].rolling(window=14).mean()# Plot the Average True Range
plt.figure(figsize=(10, 6))
plt.plot(data.index, data["ATR"])
plt.title("Average True Range (ATR)")
plt.xlabel("Date")
plt.ylabel("ATR")
plt.show()

Volatility Index (VIX)
The Volatility Index, also known as the VIX or “fear gauge,” measures the market’s expectation of future volatility. It is often used as a contrarian indicator, as high VIX levels indicate increased market uncertainty and vice versa. Here’s how to fetch and plot the VIX data:
# Fetch the VIX data from Yahoo Finance
vix_data = yf.download("^VIX", start=start_date, end=end_date)# Plot the VIX
plt.figure(figsize=(10, 6))
plt.plot(vix_data.index, vix_data["Close"])
plt.title("Volatility Index (VIX)")
plt.xlabel("Date")
plt.ylabel("VIX")
plt.show()

Volatility indicators play a crucial role in understanding market conditions and developing effective trading strategies. In this article, we explored key volatility indicators such as Bollinger Bands, Average True Range (ATR), and the Volatility Index (VIX). We also demonstrated how these indicators can be utilized to enhance trading strategies using Python. By incorporating volatility analysis into your trading approach, you can make more informed decisions and adapt to changing market conditions.
Remember, these indicators should be used in conjunction with other technical and fundamental analysis tools to develop a comprehensive trading strategy. Happy trading!


